Compliance Area outcomes
Analysis of outcomes against Compliance Areas in 2015
The Chartered Trading Standards Institute has devised a set of Compliance Areas which cut across all areas of RECC's work. We have supplemented the 2015 Annual Report with this analysis of our monitoring outcomes by Compliance Area. This will allow us to see which are the principal areas of consumer detriment in the sector and to ensure that our work across sections is as joined-up as possible
Please
click here to download this page as an Adobe PDF document.
RECC's Annual report includes an explanation of the Code's monitoring strategy and of the 10 Key Compliance Areas under which RECC records the results of:
- a rolling Consumer Satisfaction Survey (CSS)
- compliance audits of members and
- consumer complaints.
The current analysis presents the monitoring results for each of these elements separately (as set out in RECC's Annual Report). It then brings these results together, along with some additional data, to show the performance overall against each Compliance Area.
The 10 Key Compliance Areas
CA1: Awareness of consumer protection / RECC (including staff training)
CA2: Microgeneration Certification Scheme (MCS)
CA3: Marketing and selling
CA4: Estimates/quotes, particularly performance estimates and financial incentive
CA5: Finance agreements
CA6: Contracts and cancellation rights
CA7: Taking and protection of deposits and advanced payments
CA8: Completing the installation
CA9: After –sales (guarantees, workmanship warranties and warranty protection, after sales support: customer service)
CA10: Disputes numbers, handling, procedures
Monitoring results
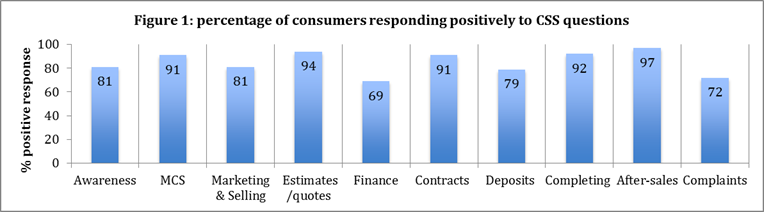
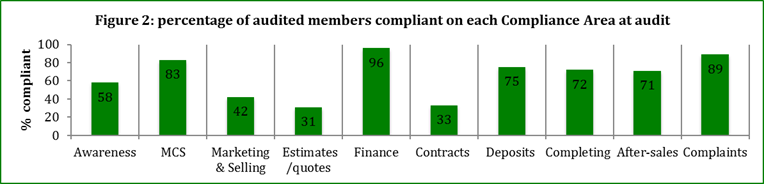
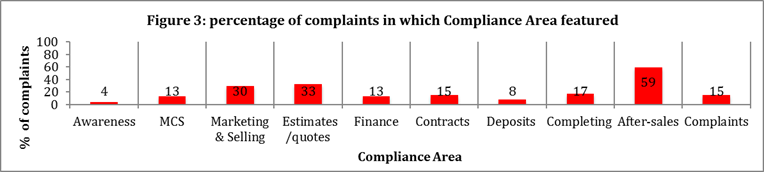
Figures 1 to 3 show the results graphically under each of the Compliance Areas areas in:
- RECC's Consumer Satisfaction Survey (Figure 1)
- audits of members (Figure 2) and
- complaints about members (Figure 3).
The Annual Report provides more detailed commentary on each of these planks of the monitoring programme (see pp 27-29, 22 -25 and 33-43 respectively). Highlighted points include:
- overall very positive results from the Consumer Satisfaction Survey (CSS) eg 80% rating their satisfaction with the way the system was sold and installed at 9/10 or 10/10 (not shown in Figure 1). There was slightly less positive feedback in the areas of the consumer being made aware of RECC (part of CA1) and of the existence of a dispute resolution procedure (part of CA10) and, for those buying the system on finance, on the information and documentation on a finance agreement (part of CA5);
- the most frequent area of non-compliance found at audits was in pre-contractual information, contracts and cancellation rights;
- after-sales (guarantees, workmanship warranties and warranty protection, after-sales support and customer service) was the most frequently-featured Compliance Area in disputes.
As the Annual Report outlines, RECC has used these results to steer its work in producing model documents, running webinars and providing training, as well as in providing the focus of its compliance activities.
The following section brings together all the performance measures from the monitoring programme under each of the 10 Compliance Areas.
Performance measures
Table 1 provides the 10 Key Compliance Areas with all associated performance measures against which RECC undertook to report. The areas are shaded to show their relative priority – the darker the shade, the higher the priority.
Table 1: Performance by Compliance Area
| CA1: Awareness of consumer protection / RECC (including staff training) |
- 81% of total number of CSS questionnaires returned in which consumers said they had been made aware of RECC
- 58% overall audit compliance in this area
- 65% of members at audit providing consumer leaflet with quotes
- 55% of members at audit with link to RECC on their website
- 61 (4.1%) of disputes featuring a CA1 issue
- See below for the number of members completing RECC online training:
| Section of training |
Number of exams taken in 2015 |
| The Code |
467 |
| Pre-sales activities |
345 |
|
Contracts, sub-contractors, cancellation rights |
302 |
|
Paying for the order, completing the installation |
275 |
|
After-sales |
279 |
|
Total exams taken |
1668 |
|
| CA2: Microgeneration Certification Scheme (MCS) |
-
91% of CSS responders indicating receipt of MCS handover documents within 10 days
- 83% overall audit compliance on this area
- 83% of members in current audit round found compliant on questions relating to MCS
- 97% of members at audit who are MCS-certified for the relevant technologies
- 186 (12.5%) of disputes received related to a CA2 issue
- 22% of complaints predominantly or partly about technical issues, which are referred on to MCS Certification Bodies (CBs)
|
| CA3: Marketing and selling |
-
81% of CSS responders satisfied with how the system was sold – (9/10 or 10/10; c. 10% 8/10)
- 42% overall audit compliance on this area
- 448 (30.2%) of disputes registered that relate to marketing and selling
|
|
CA4: Estimates/quotes, particularly performance estimates and financial incentive |
-
94% of CSS responders indicating sufficient pre-contractual information was provided
- 31% overall audit compliance in this area
- 489 (32.9%) of disputes registered that relate to estimates etc
|
|
CA5: Finance agreements: overall audit compliance |
-
8% of CSS responders indicating that they took finance; 69% of those who consider they were given adequate information and documentation
- 36 companies (23% of the members audited) indicated they are offering finance. Of these, 81% (29 companies) were found to be compliant, the remaining 7 companies were non-compliant.
- 192 (12.9%) of disputes registered relating to finance agreements with members
|
|
CA6: Contracts and cancellation rights |
-
91% of CSS responders indicating no concerns about the contract
- 33% overall audit compliance in this area
- 220 (14.8%) of disputes registered that relate to contractual issues and/or cancellation rights
|
|
CA7: Taking and protection of deposits and advanced payments |
-
82% of CSS respondents indicating they paid a deposit, of which 79% said they'd received an insurance policy protecting it
- 85% overall audit compliance in this area
- 71% of members indicated at audit that they take deposits
- Of these, 75% had deposit insurance in place at audit; Of those that did not, 72% had it in place by the end of the audit process (the remainder, 8 members, were referred to the Non-Compliance Team)
- 112 (7.5%) of disputes registered that relate to deposits
|
|
CA8: Completing the installation |
-
80% of consumers completing CSS questionnaires satisfied with the system they have installed (9 or 10/10), 12% 8/10
- 72% overall audit compliance in this area
- 248 (16.7%) number and % of disputes registered that relate to completing the installation
|
|
CA9: After –sales (guarantees, workmanship warranties and warranty protection, after sales support: customer service) |
- 97% of CSS respondents indicating they were provided with at least a 2-year workmanship warranty
- 86% of CSS respondents indicating they were provided with warranty insurance
- 71% overall audit compliance in this area
- 869 (5.9%) of disputes registered that relate to after-sales issues
|
|
CA10: Disputes numbers, handling, procedures |
- 72% of CSS respondents indicating they were informed about a disputes procedure
- 12% of CSS respondents indicating they made a complaint to the member; of these, 44% were satisfied with its handling
- 89% overall audit compliance in this area
- 222 (14.9%) of disputes that relate to complaints
- 1,485 disputes registered by RECC
Of which:
- 55 within RECC's remit
- 403 feedback about members
- 57 feedback about non-members
- 64 non-domestic
- 181 potential
- 355 referred onwards
- number of disputes received by issue – in order of CA
- CA1: 61
- CA2: 186
- CA3: 448
- CA4: 489
- CA5: 192
- CA6: 220
- CA7: 112
- CA8: 248
- CA9: 869
- CA10: 222
- 121 (54%) of in-remit disputes resolved by RECC dispute resolution case workers (see Table 3 below).
Table 2: Disputes registered with RECC by technology and as % of all domestic installations of that technology
| Technology |
Percentage |
Disputes registered with RECC |
Total domestic installations |
| ASHP |
2.7 |
108 |
4,025 |
| Biomass |
3. |
160 |
4,150 |
| GSHP |
3.1 |
28 |
894 |
| Solar PV |
0.7 |
948 |
142,250 |
| Solar thermal |
4.8 |
48 |
997 |
Table 3: Elements of dispute resolution brokered by RECC case workers
| Elements of resolution brokered by RECC* |
Number |
| Total resolutions by RECC |
121 |
| Of which: |
| refunds |
50 |
| compensation/price reduction |
33 |
| goodwill gesture |
3 |
| cancellation of contract and/or amendment |
17 |
| removal of system |
16 |
| replacement |
4 |
| repair/remedy problem |
9 |
*Resolving disputes may involve more than one element, hence the total number of elements of resolution is greater than the total number of resolved disputes.
Table 4: Average length of time taken for RECC case-workers to resolve disputes
| 27 weeks was the average length of time taken by RECC case workers to resolve disputes (60% took less, 40% took more) |
| 72 (31%) of in remit disputes resolved by means of independent arbitration |
|