Compliance Area outcomes
Analysis of outcomes against Compliance Areas in 2016
RECC's Annual report includes an explanation of the Code’s monitoring strategy and of the 10 Key Compliance Areas under which RECC records the results of:
- a rolling Consumer Feedback Survey (CSS)
- compliance audits of members and
- consumer complaints.
The current analysis presents the monitoring results for each of these elements separately (as set out in RECC’s Annual Report). It then brings these results together, along with some additional data, to show the performance overall against each Compliance Area. The object of this analysis is to assess the extent to which consumer detriment has been prevented across the spectrum of the Code.
The 10 Key Compliance Areas
CA1: Awareness of consumer protection / RECC (including staff training)
CA2: Microgeneration Certification Scheme (MCS)
CA3: Marketing and selling
CA4: Estimates/quotes, particularly performance estimates and financial incentive
CA5: Finance agreements
CA6: Contracts and cancellation rights
CA7: Taking and protection of deposits and advanced payments
CA8: Completing the installation
CA9: After –sales (guarantees, workmanship warranties and warranty protection, after sales support: customer service)
CA10: Disputes numbers, handling, procedures
Monitoring results
Figures 1 to 3 show the results graphically under each of the Compliance Areas areas in:
- RECC’s Consumer Feedback Survey (Figure 1)
- audits of members (Figure 2) and
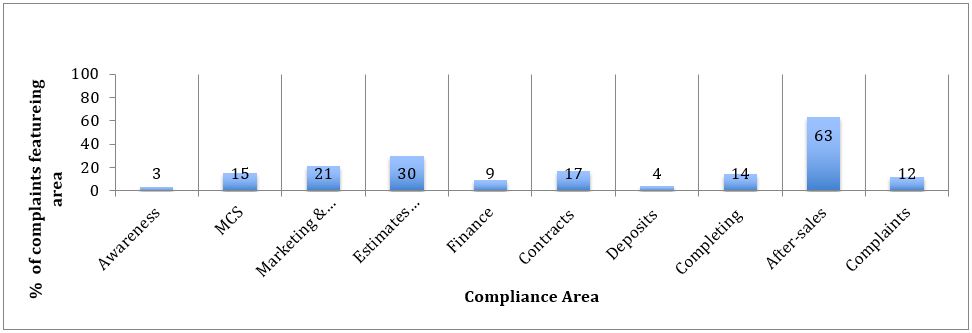
- complaints about members (Figure 3).
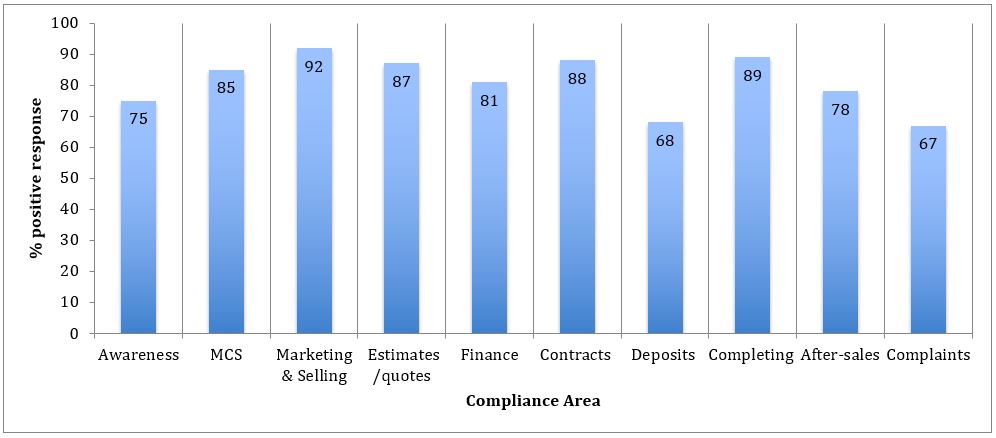
Figure 2: % of audited members compliant on each Compliance Area at audit
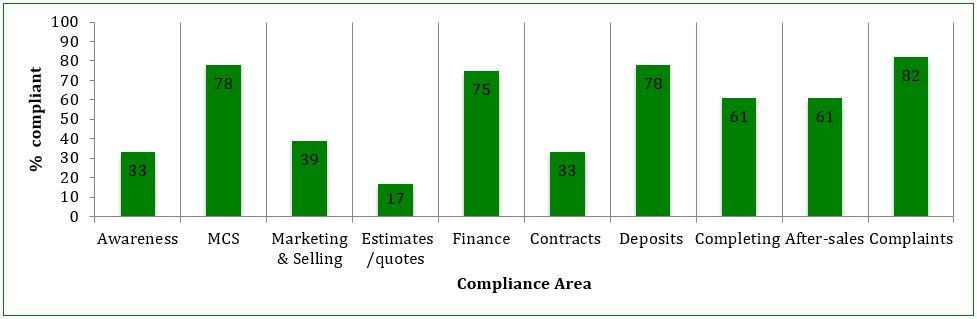
Figure 3: % of disputes registered in which Compliance area featured
The Annual Report provides more detailed commentary on each of these planks of the monitoring programme (see pp 26-29, 20-25 and 34-44 respectively). Highlighted points include:
- overall the majority of consumers who provided feedback were positive about their experience with RECC members, with 80% rating their overall experience as 4/5 or 5/5, indicating they were satisfied or very satisfied. There was slightly less positive feedback in the areas of the consumer being made aware of the existence of a dispute resolution procedure (part of CA10) and of deposit protection (CA 7): of the 75% of respondents who had paid a deposit, 68% confirmed they had received an insurance policy which protected it;
- the most frequent area of non-compliance found at audits was in pre-contractual information, contracts and cancellation rights and awareness of the Code;
- after-sales (guarantees, workmanship warranties and warranty protection, after-sales support and customer service) was the most frequently-featured Compliance Area in disputes.
As the Annual Report outlines, RECC has used these results to steer its work in producing model documents, running webinars and providing training, as well as in providing the focus of its compliance activities.
The following section brings together all the performance measures from the monitoring programme under each of the 10 Compliance Areas.
Performance measures
Table 1 provides the 10 Key Compliance Areas with all associated performance measures against which RECC undertook to report. The areas are shaded to show their relative priority – the darker the shade, the higher the priority.
Table 1: Performance by Compliance Area
| Awareness of consumer protection / RECC (including staff training) |
|---|
|
| CA2: Microgeneration Certification Scheme (MCS) |
|
| CA3: Marketing and selling |
|
| CA4: Estimates/quotes, particularly performance estimates and financial incentive |
|
| CA5: Finance agreements: overall audit compliance |
|
| CA6: Contracts and cancellation rights |
|
| CA7: Taking and protection of deposits and advanced payments |
|
| CA8: Completing the installation |
|
| CA9: After –sales (guarantees, workmanship warranties and warranty protection, after sales support: customer service) |
|
| CA10: Disputes numbers, handling, procedures |
|
Table 2: Disputes registered with RECC by technology and as % of all domestic installations of that technology
| Technology | Percentage | Disputes registered with RECC | Total domestic installations |
|---|---|---|---|
| ASHP | 2.1 | 108 | 5,135 |
| Biomass | 11.7 | 113 | 962 |
| GSHP | 2.3 | 28 | 1,236 |
| Solar PV | 1.0 | 764 | 73,306 |
| Solar thermal | 9.7 | 64 | 660 |
Table 3: Elements of dispute resolution brokered by RECC case workers
| Elements of resolution brokered by RECC* | Number |
|---|---|
| Total resolutions by RECC | 86 |
| Of which: | |
| refunds | 23 |
| compensation/price reduction | 37 |
| goodwill gesture | 2 |
| cancellation of contract and/or amendment | 6 |
| removal of system | 8 |
| repair/remedy problem | 18 |
* Resolving disputes may involve more than one element, hence the total number of elements of resolution is greater than the total number of resolved disputes.
Table 4: Resolution of disputes within RECC’s remit
| 24 weeks was the average length of time taken by RECC case workers to resolve disputes |
| 87 (48%) of in-remit disputes resolved in 2016 were resolved by means of independent arbitration |